Best Scientific 3D Visualization Libraries for Python
This posts reviews the best four open-source libraries for three-dimensional scientific visualization, including standalone applications or scriptable tools that can be used from Python.

Scientific visualization of large 3D datasets is a complex task for which specialized software libraries have been developed for quite some time.
Unlike other areas of CAD or CAE, 3D visualization software has mostly been open-source since the beginning. In particular, all libraries reviewed in this post offer permissive licenses which allow commercial use.
Importantly, there are two kinds of tools we can rely on.
On one hand, we have large standalone applications like Paraview or VisIt, which are very powerful but can have a step learning curve. With these tools there are few to no limitations on what can be accomplished, including visualizations of extremely massive datasets using sophisticated algorithms. While these tools offer support for scripting, the most usual workflow is to use them to open a file for post-processing.
On the other hand, there are smaller software projects more strongly associated with programming languages such as Python or Julia, which focus on easy and seamless use from within the language. As such, these tools can be easier to use, but have more limitations on the sizes of the datasets that can be managed, fewer built-in algorithms and supported data formats.
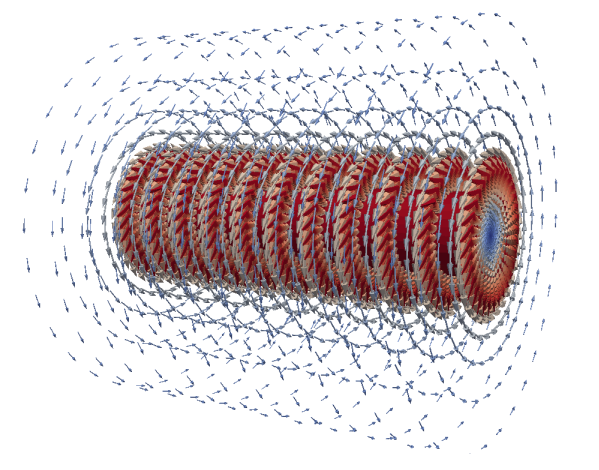
Paraview (Python and standalone)
Perhaps the most well-known scientific visualization software suite, ParaView, is developed by Kitware in alliance with Los Alamos and Sandia National Labs, among other partners. ParaView relies on the Visualization Tool Kit (VTK), also developed by Kitware, to provide the visualization building blocks and the data processing model.
It is best suited for post-processing data arising from large numerical simulations. For this purpose, it supports the most complex visualizations of massive datasets via distributed processing.
Paraview includes a graphical user interface and a Python shell. A related tool, ParaViewWeb, can be used to build interactive scientific visualization applications inside Web browsers.
Importantly, there is an open discourse forum to ask for help.
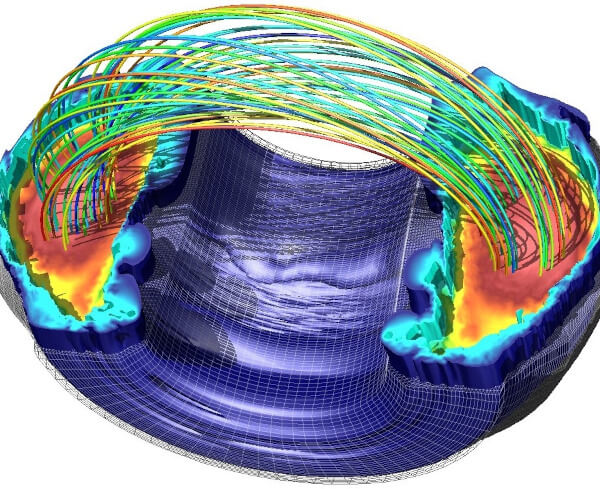
VisIt (Python and standalone)
The VisIt software suite, developed at the Lawrence Livermore National Laboratory (LLNL), was first released in 2002, and offers a powerful suite of visualization functionalities, including parallel processing, support for multiple scientific data formats, and Python scripting.
As with Paraview, VisIt also leverages VTK for the basic building blocks, as well as Python scripting. At the same time, specific efforts have been made in parallelization to extremely massive scales, incorporating support of non-standard data models. In particular, one of the salient points of VisIt is that it supports a very large number of input file formats (see reference).
Documentation at visitusers.org. Documentation for the Python interface.
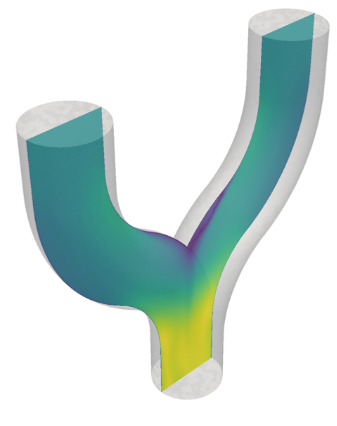
PyVista (Python)
Also based on VTK, the PyVista library provides visualization routines for 3D data and modales, and it aims for ease of use and broad applicability across science and engineering.
It’s primary intent was to be an abstraction layer over VTK to provide convenience and functionality to VTK exposed “Pythonically”. In particular, it supports most or even all of VTK’s functionality, including, for example parallel files, which are required for the visualization of extremely large datasets.
The PyVista developers also support various related tools, including PyMeshFix for repairing holes in PyVista surface meshes, a [TetGen wrapper for Python] (https://github.com/pyvista/tetgen), and PyACVD, a Python implementation of the surface mesh resampling algorithm ACVD.
Mayavi (Python)
Also based on VTK, MayaVi is a Python library for 3D visualization. It focuses on the creation of visualization scenes directly from Python, offering easy and seamless integration with other scientific libraries in the Python ecosystem.
One of the downsides is that it can be slow for very large datasets, as in particular it doesn’t support parallel file formats.
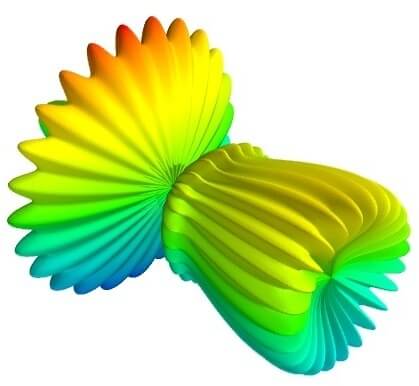
Example from Mayavi documentation
Master Open-Source FEM for Electromagnetics
Don't Just Run Simulations. Trust Them.
Check out the Course!